Zenon Palacz, IsotopX Ltd, Middlewich, Cheshire, UK.
Introduction
Abundance sensitivity is a measure of the contribution of the peak ‘tail’ of a major isotope on an adjacent minor isotope. The tailing is due to the collision of ions with residual gas molecules in the mass spectrometer causing a loss of ion energy. This is manifest on a mass spectrum as a loss in mass giving rise to a ‘tail’ on the low mass side of a peak. Hence there is a direct correlation between abundance sensitivity and the quality of the analyser vacuum.
Additionally, since any peak tail contribution from a major isotope will be proportional to its beam size, the associated errors will produce an apparent non-linearity in the measured ratio. Hence it is crucial that an MS system has low inherent abundance sensitivity and that an effective correction can be made for any small contribution that remains.
By convention, abundance sensitivity is referred as the contribution of the 238U peak on mass 237 where there are no U isotopes, e.g 237/238U = 5e-6 or 5ppm. In U analysis the abundance sensitivity is of particular importance since the 236U isotope of natural samples is less than 1ppm of the 238U peak so that even a small amount of 238U peak tailing down to m/z 236 is significant.
Experimental
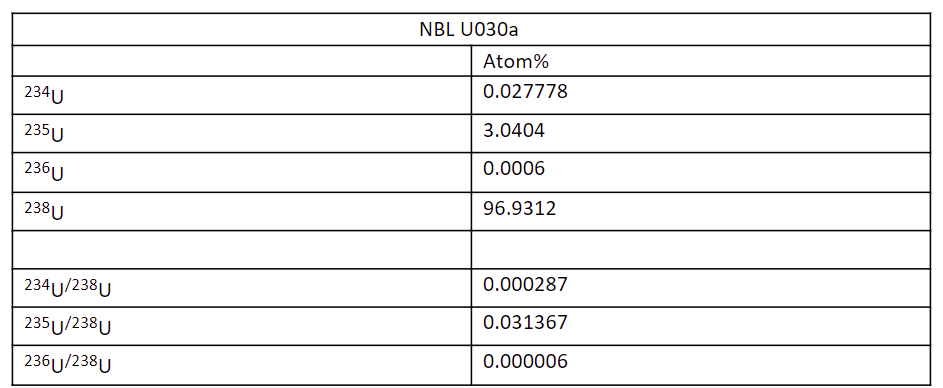
We have used the standard U030a to illustrate the effect of abundance sensitivity on the Phoenix Thermal Ionization Mass Spectrometer. The certified isotopic composition of U030a is shown in Table 1.

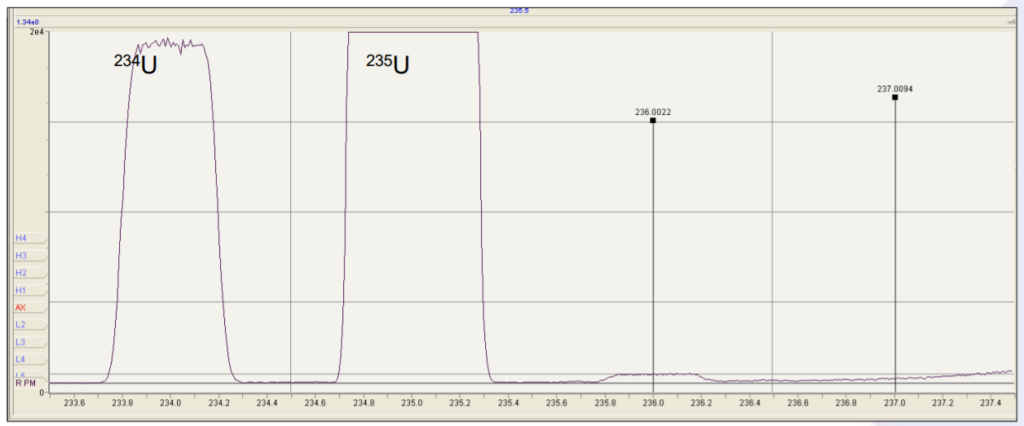
Figure 1 shows a mass scan on the axial ion counting Daly detector from m/z 233.5 to mass 237.5. The peak on the left is the 234U isotope which has an isotopic abundance of 287ppm of the 238U which is off scale to the right of this figure. The 235U peak is off scale on this scan, whilst the 236U peak with an abundance of 5.86ppm relative to the 238U is very small. The flat top of the 236U is clearly apparent, and the peak itself is readily resolvable from the baseline.
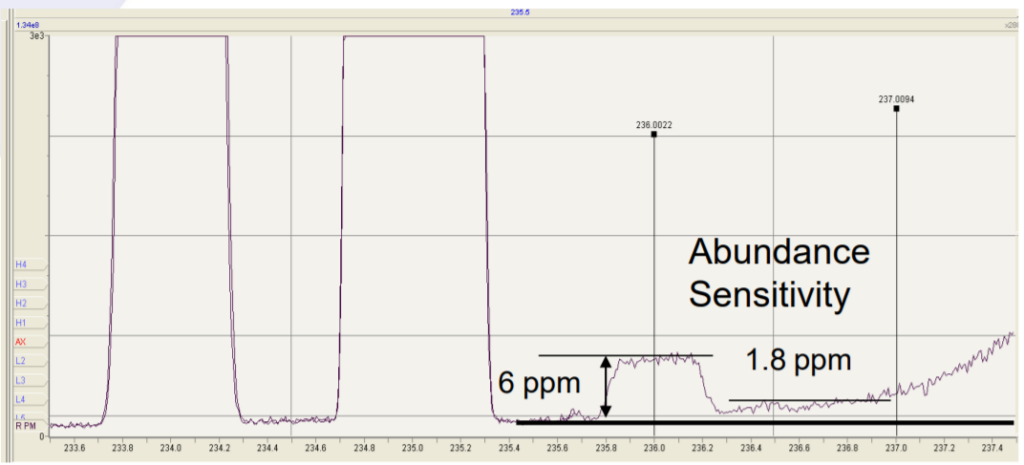
To the right of the 236U peak there is a clear uplift in baseline due to the peak tail from the 238U. This is shown in more detail in Figure 2 (over).


Figure 2. shows that the 238U peak tail extends very slightly beneath the 236U peak. At mass 237 the tail is less than 1/3 that of the 236U peak, and the abundance sensitivity is 1.8ppm. The analyser vacuum was <2e-9 mbar.
Summary
The abundance sensitivity of the Phoenix TIMS is <2ppm at mass 237 with respect to 238U.
Download Technical Note
Download the complete Technical Note: Abundance Sensitivity of the Phoenix and Phoenix X62 TIMS