Introduction
Thermal Ionization Mass Spectrometry is an extremely sensitive detection technique. For Neodymium, measured as Nd+ , ion yields of 1 ion per 50 atoms loaded are typical for triple filament geometries on a Phoenix TIMS. This efficiency is of huge importance for applications where there is very little sample material e.g. garnet growth rims in metamorphic studies, or low element concentration e.g, mantle minerals such as clinopyroxene.
The sensitivity has to be coupled with sensitive detectors. Ion counters are one possible route, but their dynamic range prevents enough ions to be measured to produce sensible precision and accuracy.
The promise of using Faradays with 1e12 Ω (1T) resistors as an alternative to conventional 1e11 Ω resistors holds out promise. The theoretical noise improvement should be a factor of 3. However, this analytical benefit would be negated if for example the gain between resistors was not stable, or the baselines were unstable with time.
This work compares the isotope ratio performance of neodymium on Faraday collectors coupled with Isotopx Xact 1e11 Ω and Xact1T (1e12 Ω) amplifiers on a Phoenix TIMS system. Measurements of neodymium were made at different ion intensities focussing on ion signals in the 5 to 50mv range.
Method
We have analysed a single large load of Nd (400ng) on a triple rhenium filament assembly. The ion beam was kept very stable during an analysis, and then reduced between analyses. The analysis method chosen was the multidynamic method. This method eliminates any gain or efficiency variables, and so the only variable should be the signal/noise ratio. Measurements were taken in a 3 cycle dynamic routine which has been described elsewhere. Integration times for each mass position were 15 seconds with a 3 second delay between each mass position to allow the resistor to return to baseline before starting the next integration. A total of 200, 3 cycle, ratios were taken in 10 blocks of 20 seconds. At the start of each block baselines were measured at +/-0.5amu for each of the 3 cycles. The baselines were applied to the subsequent block of data. Since the baselines were taken either side of the peak, they also correct for any peak tailing which may occur from the peaks. This tailing would be virtually nil considering the abundance sensitivity (<1ppm) and the small size of the ion beams considered here.
Resistor response
The speed of response of the resistor (Tau) is crucial for high precision dynamic measurements. The signal must return to baseline before the next integration is taken otherwise a bias will appear which will be proportional to the size of the ion beam. The Phoenix uses new Xact electronics which have extremely fast response times compared to older generation amplifiers. For example, Xact 1e11 Ω resistors baseline from an 8e-11 A ion signal is within 2ppm of this intensity (<2e-16 A) within 2 seconds.
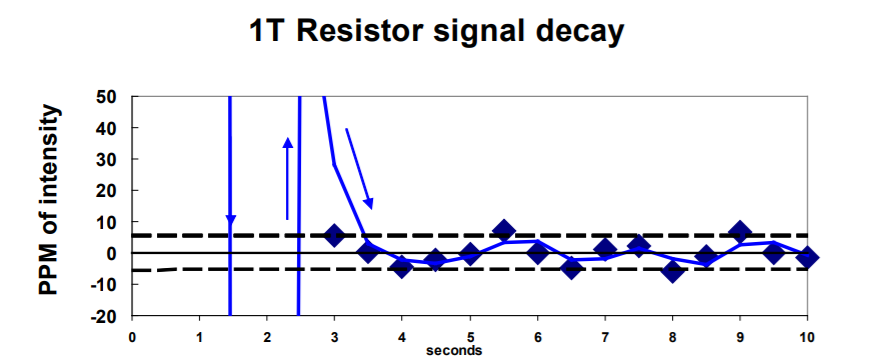
Historically, 1T (1e12 Ω) resistors have exhibited long response times, Richter et. al (2011) report having to wait 15 seconds for the ion current to decay. Figure 1 shows the Tau response of an Isotopx Xact1T (1e12 Ω) amplifier board. The ion signal was 5e-11 Amps before switching to baseline. The signal decay is extremely rapid and overshoots the zero point before rebounding back and decaying to <5ppm of the original signal within 3 seconds and returning to baseline.

Neodymium isotope ratios at different intensities.
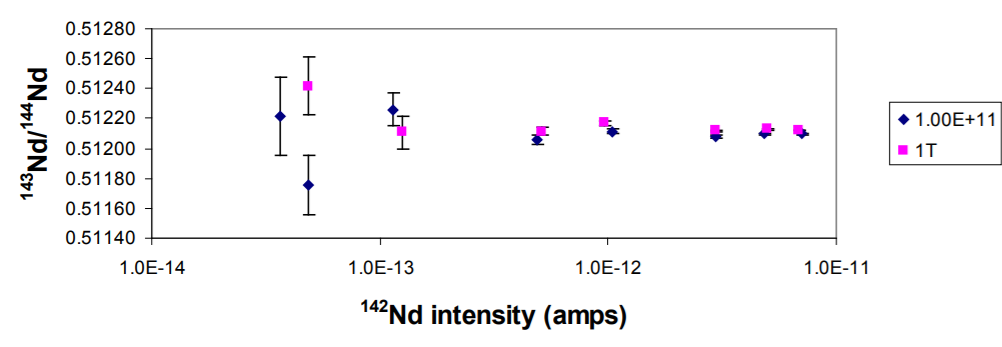
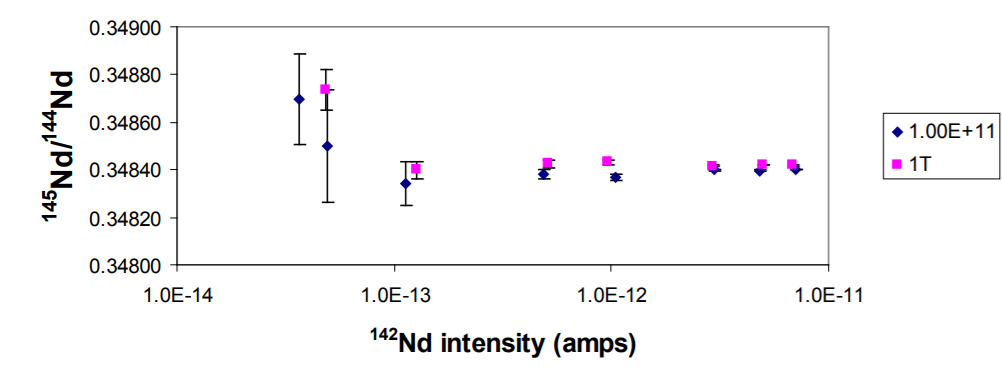
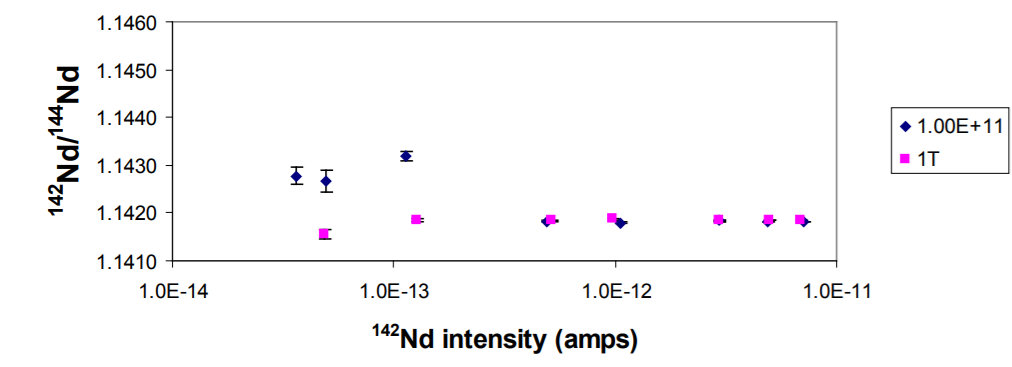
Xact 1e11 Ω resistors – Table 1 and Figures 1, 2 and 3 shows the data for isotope ratios measured using 1e11 Ω resistor between 700mv (7e-12 A) and 4 mv.
For the 143Nd/144Nd the data remain consistent until 50mv. At this point the precision on the 143Nd/144Nd is <30ppm 1se (+/-0.00003 2SE). The 145Nd/144Nd and the 142Nd/144Nd are also within error of ratios obtained at higher intensities. For lower intensities the data becomes scattered, and so a cut off at 30ppm 1rse is marked in red on Table 1 at 50mv 142Nd corresponding to 20mv 143Nd and 13mv 145Nd.
Xact1T resistors – Table 1 and Figures 1, 2 and 3 shows a series of measurements using the 1T resistor. At the higher intensities the ratios are identical within error to the 1e11 Ω resistors. This indicates that the tau response is adequate. As the intensity decreases the ratio remains constant until 13mv below which the errors expand and the ratio is neither precise nor accurate. The limit is marked in red on Table 1 and is just over 3 times lower in intensity than the 1e11 Ω data. Interestingly the precision and accuracy at ~ 50mv 142Nd is the same for both 1e11 and 1e12 Ω resistors with precision of <30ppm 1RSD for the 143Nd/144Nd obtained.
Conclusions
Using Isotopx Xact Faraday amplifiers multidynamic measurements are possible at low intensities and accurate and precise data can be obtained for both 1e11 Ω and 1T (1e12 Ω) resistors.
At intensities down to 50mv 142Nd the data are essentially the same irrespective of the resistor value with precision at 50mv 142Nd of <30ppm 1RSD.
With Xact1T resistors the isotope ratio remains precise (<100ppm 2se) and accurate down to 10mv 144Nd and 5mv 143Nd, below this the errors expand and the data is not useable.
| 1E+11 | 142Nd (amps) | 142Nd (mv) | 143Nd/144Nd | %1se | 145Nd/144Nd | %1se | 142Nd/144Nd | %1se |
| 7.1E-12 | 706 | 0.512095 | 0.0003 | 0.348402 | 0.0003 | 1.141827 | 0.0005 | |
| 4.9E-12 | 485 | 0.512096 | 0.0004 | 0.348395 | 0.0004 | 1.141819 | 0.0006 | |
| 3.0E-12 | 296 | 0.512082 | 0.0008 | 0.348399 | 0.0008 | 1.141837 | 0.0012 | |
| 1.1E-12 | 105 | 0.512113 | 0.0016 | 0.348371 | 0.0020 | 1.141793 | 0.0019 | |
| 4.9E-13 | 49 | 0.512057 | 0.0028 | 0.348383 | 0.0030 | 1.141822 | 0.0042 | |
| 1.1E-13 | 11 | 0.512261 | 0.0106 | 0.348341 | 0.0135 | 1.143178 | 0.0139 | |
| 4.9E-14 | 5 | 0.511754 | 0.0191 | 0.348499 | 0.0340 | 1.142667 | 0.0265 | |
| 3.6E-14 | 4 | 0.512215 | 0.0257 | 0.348698 | 0.0274 | 1.142779 | 0.0221 | |
| 142Nd (amps) | 142Nd (mv) | 143Nd/144Nd | %1se | 145Nd/144Nd | %1se | 142Nd/144Nd | %1se | |
| 1T | 6.88E-12 | 688 | 0.512121 | 0.0003 | 0.348419 | 0.0003 | 1.141855 | 0.0005 |
| 4.98E-12 | 498 | 0.512127 | 0.0003 | 0.348421 | 0.0003 | 1.141861 | 0.0005 | |
| 2.94E-12 | 294 | 0.512117 | 0.0006 | 0.348415 | 0.0006 | 1.141837 | 0.0007 | |
| 9.67E-13 | 97 | 0.512169 | 0.0010 | 0.348432 | 0.0017 | 1.141870 | 0.0013 | |
| 5.16E-13 | 52 | 0.512116 | 0.0023 | 0.348425 | 0.0022 | 1.141833 | 0.0018 | |
| 1.26E-13 | 13 | 0.512106 | 0.0042 | 0.348400 | 0.0050 | 1.141863 | 0.0045 | |
| 4.83E-14 | 5 | 0.512418 | 0.0083 | 0.348734 | 0.0123 | 1.141554 | 0.0105 |
References Richter, S., Kuhn, H., Aregbe, Y., Hedberg., Horta-Domenech., Mayer K., Zuleger E., Burger S., Boulyga S., Kopf A., Poths J., Mathew K. 2011 Improvements in routine uranium isotope ratio measurements using the modified total evaporation method for multi-collector thermal ionization mass spectrometry. J.Anal At. Spectrom, 2011, 26, 550-564.


Discover the Phoenix
If you use Thermal Ionization Mass Spectrometry in your research contact Isotopx today and find out how the Phoenix can help you.
Download the Technical Note
Download the Technical Note: Multidynamic Measurement of Small Neodymium (Nd+) ion signals on Faradays using Xact Amplifiers with 1e11 Ω and 1e12 Ω (1T) resistors.